Overview
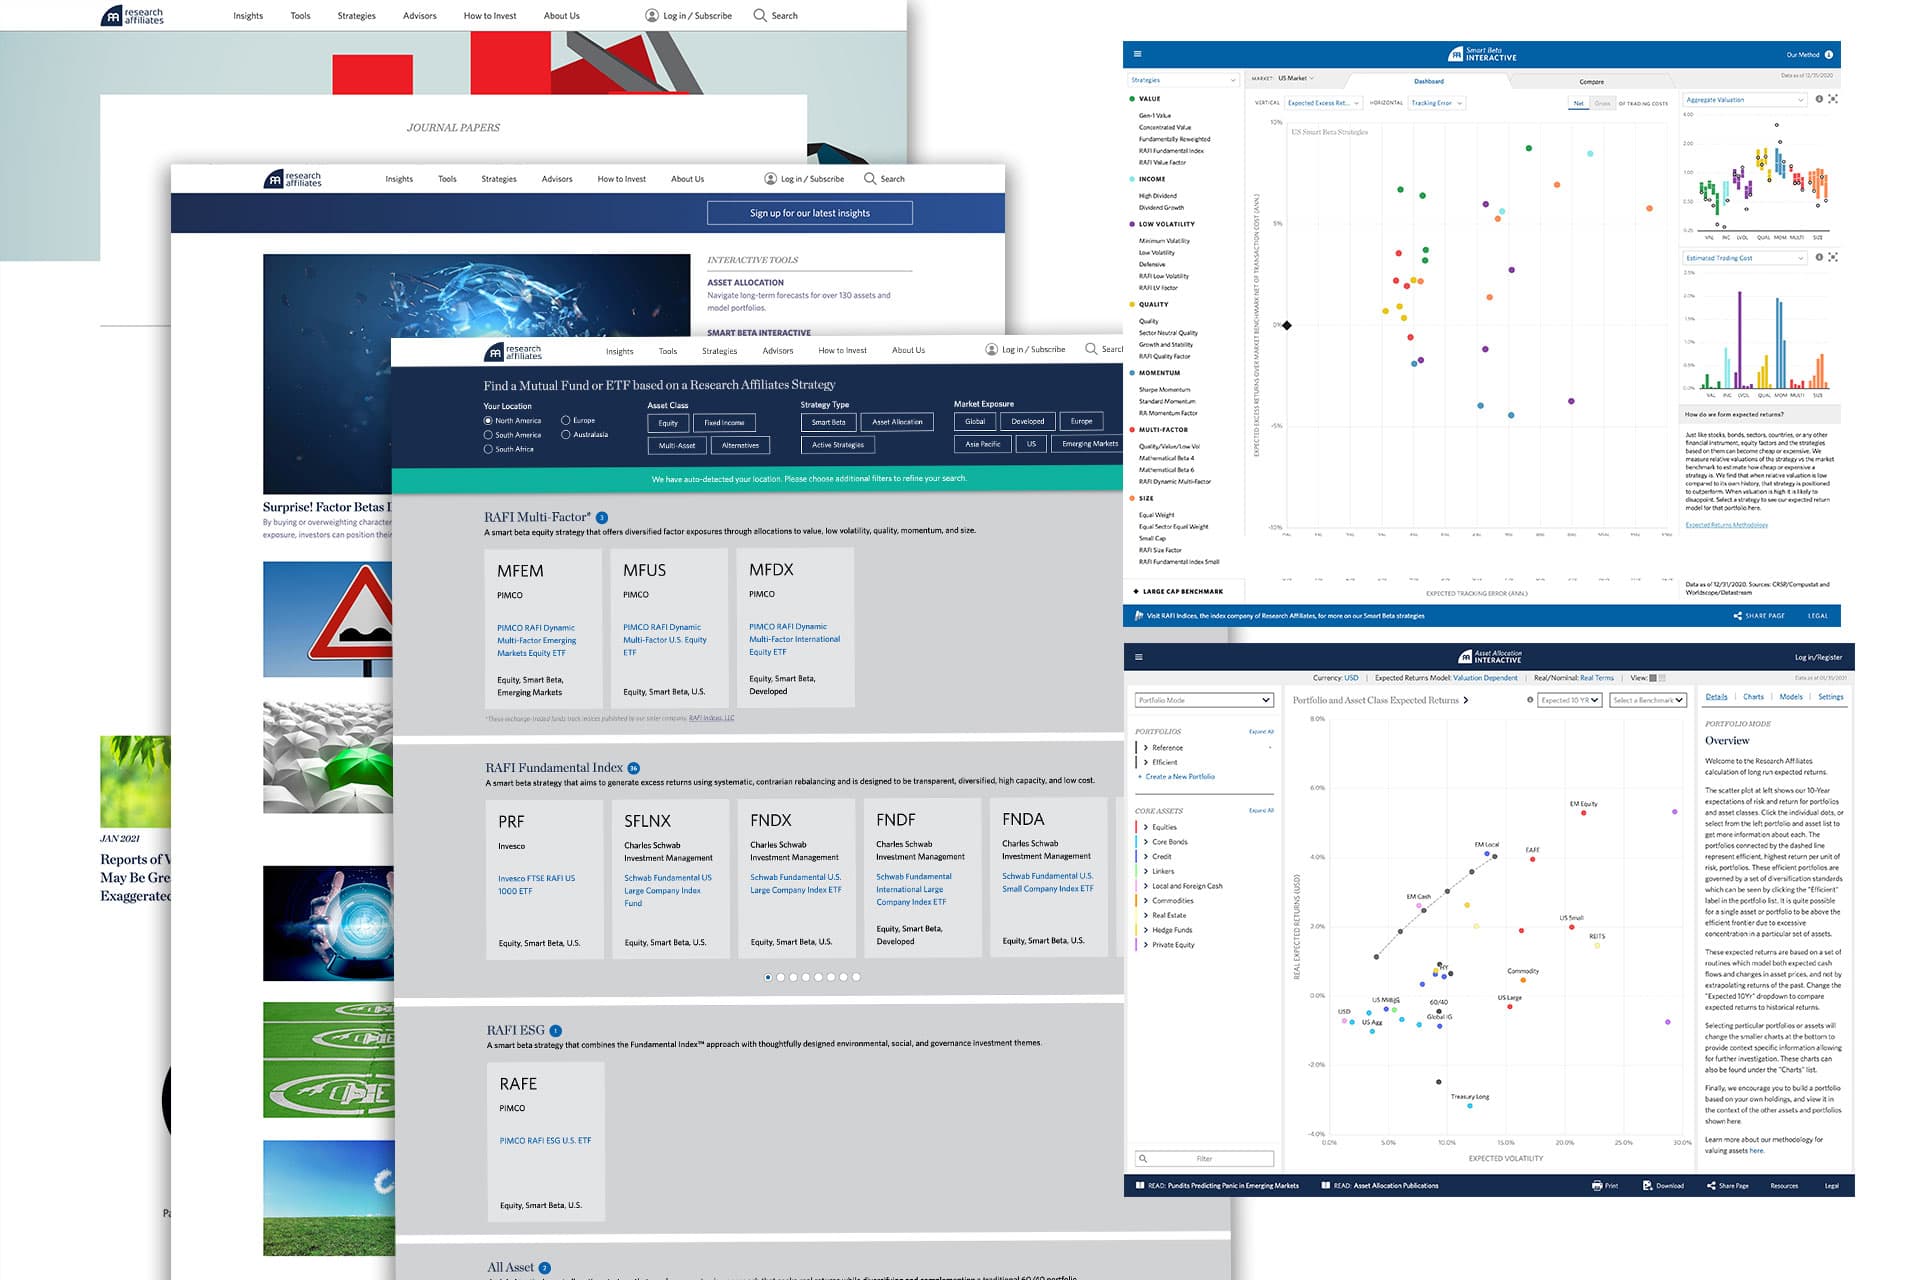
Research Affiliates is a leading asset management firm and pioneer of fundamental indexing and the RAFI strategy, with roughly $130 billion managed globally through partners including PIMCO, Invesco, and Schwab. As Sr. Associate, Product & UX, I led product and design strategy for their flagship platform: Asset Allocation Interactive (AAI).
AAI is a live, data-driven research tool that lets institutional advisors compare expected 10-year real returns across 50+ global asset classes, equities, bonds, commodities, real estate, and model portfolios, against expected volatility. The challenge: translate complex proprietary models into an interface precise enough for institutional use, yet fast enough for advisors who need answers quickly.
~$130B
Assets under management
50+ Assets
Global asset classes modeled
+13% Users
Platform user growth
+16%
Returning visitor growth
The Design Challenge
Core Tension
Institutional investment data is dense: dozens of asset classes, multiple return models, expected vs. trailing metrics, valuation-dependent vs. historical assumptions, portfolio-level aggregations. The audience is sophisticated but time-constrained: advisors need to find an insight, compare scenarios, and present to clients, not learn a new interface. Oversimplify and you lose credibility; over-engineer and the tool becomes a barrier instead of an accelerator. Every decision lived in that tension.
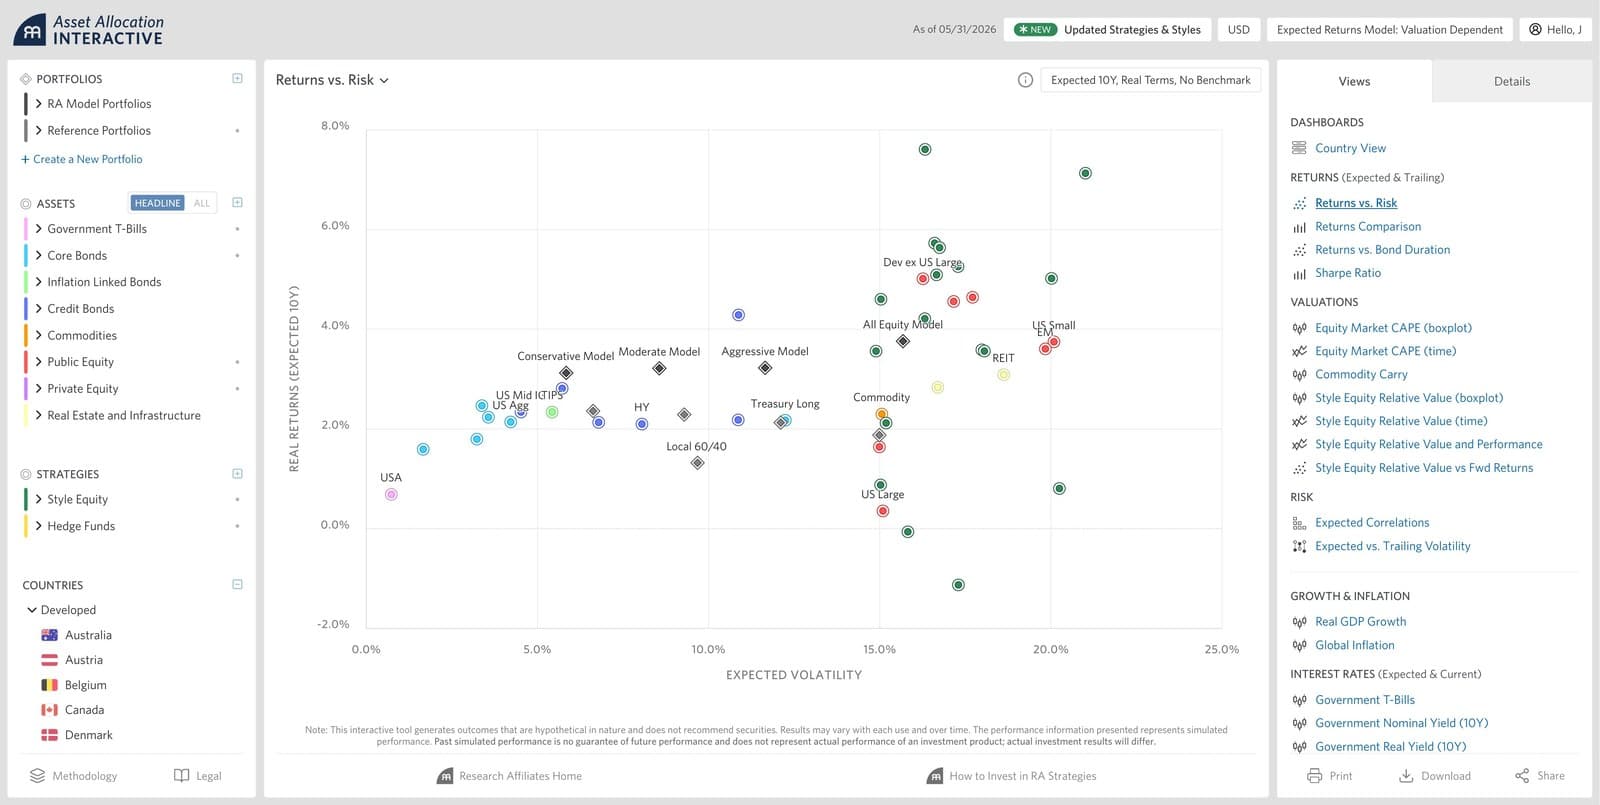
Returns vs. Risk. Full Asset Universe
The primary AAI view is a scatter plot mapping every asset class by expected 10-year real return against volatility. The left nav organizes assets into a collapsible hierarchy: Government T-Bills, Core Bonds, Inflation Linked Bonds, Credit Bonds, Commodities, Public Equity, Private Equity, Real Estate, plus Strategies and Countries with flag indicators for each market. Color-coding lets advisors instantly parse clusters: bonds lower-left, equities upper-right, RA Model Portfolios anchoring the middle. Each dot is interactive: hovering reveals the asset name and exact return/volatility coordinates.
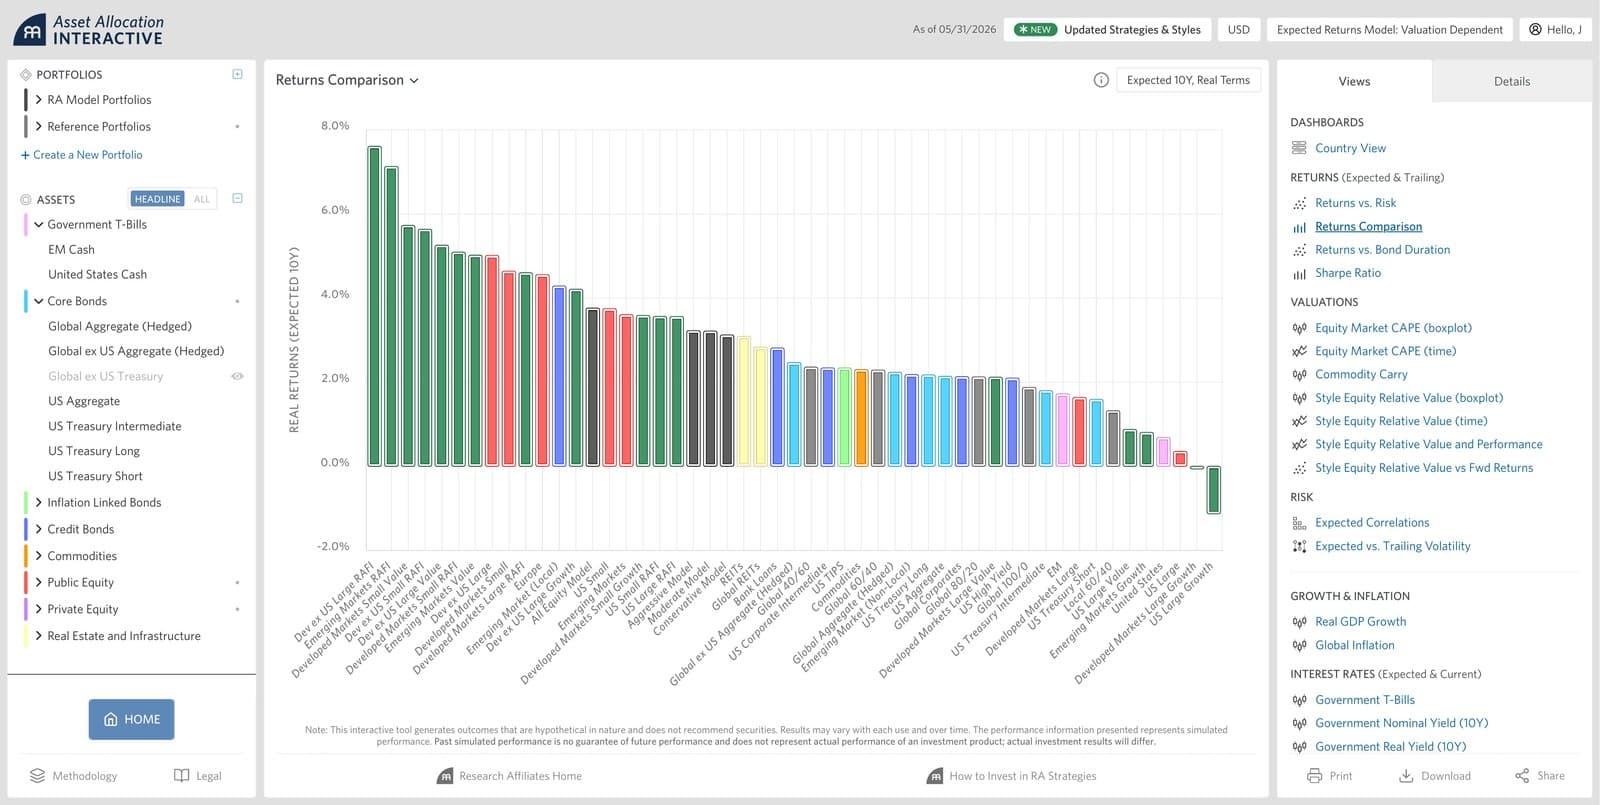
Returns Comparison. Ranked Bar Chart
The Returns Comparison view shifts from scatter to bar, ranking every asset class by expected 10-year real return. Built for advisors who need a quick answer: which asset classes offer the best expected return? Color-coding persists from the scatter view for a consistent mental model. RAFI strategies consistently rank in the upper tier (Dev ex US Large RAFI at 7.6%, Emerging Markets RAFI at 7.1%), making the case for factor-based investing directly within the tool.
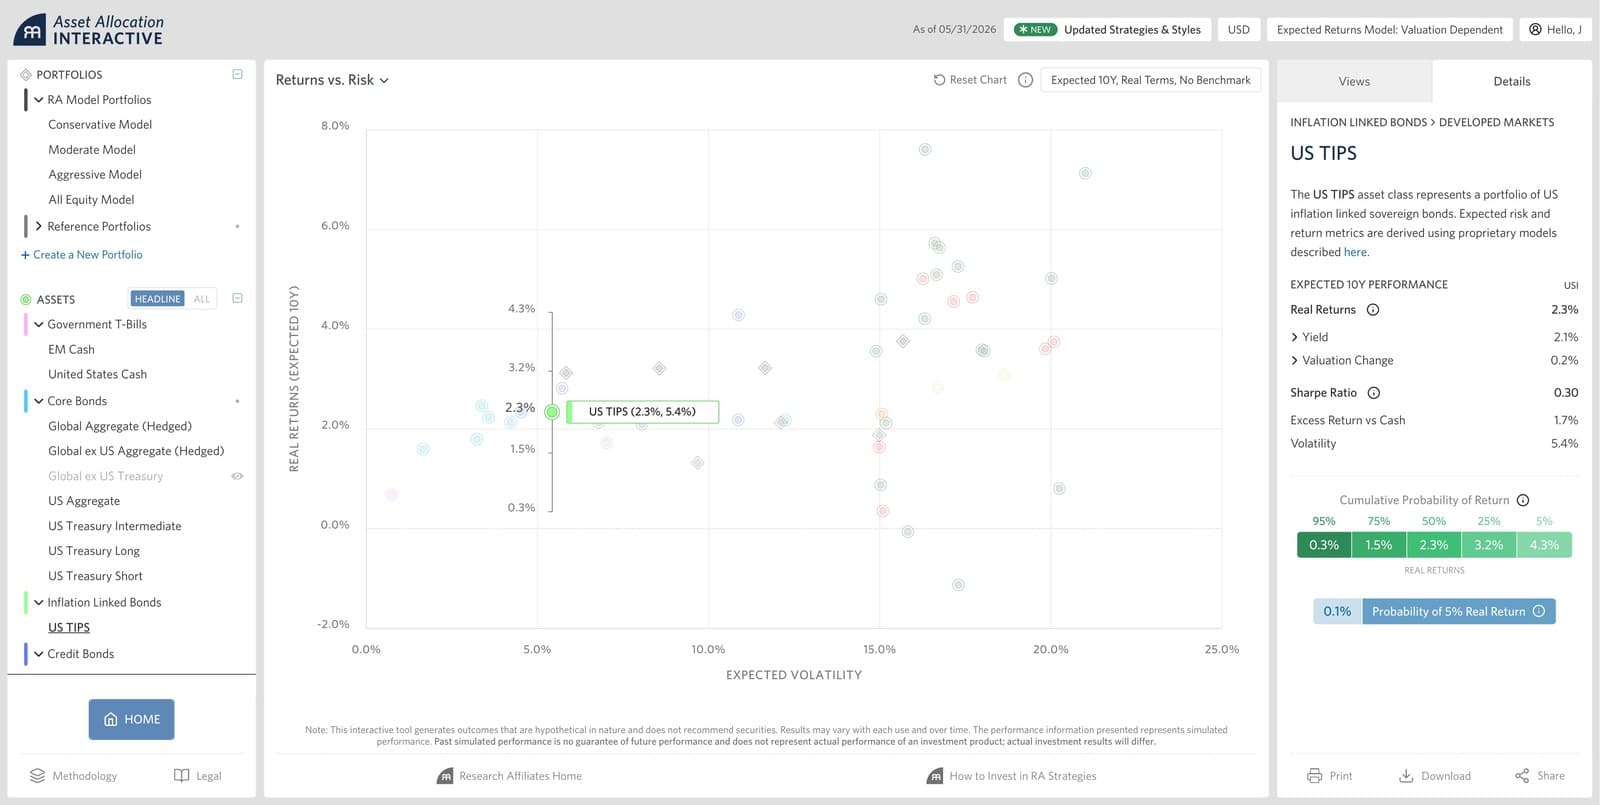
Asset Detail Panel. Probability Distributions
Selecting any asset opens a Details panel in the right rail with the full expected performance breakdown: Real Returns, Yield, Valuation Change, Sharpe Ratio, Excess Return vs. Cash, and Volatility. Below that, a Cumulative Probability of Return distribution (5th–95th percentile) gives advisors a probabilistic view of risk rather than a single-point estimate. For US TIPS: 2.3% expected real return, 2.1% yield, 0.30 Sharpe ratio, 5.4% volatility, and just a 0.1% probability of 5%+ real returns: the precision institutional investors need to allocate with confidence.
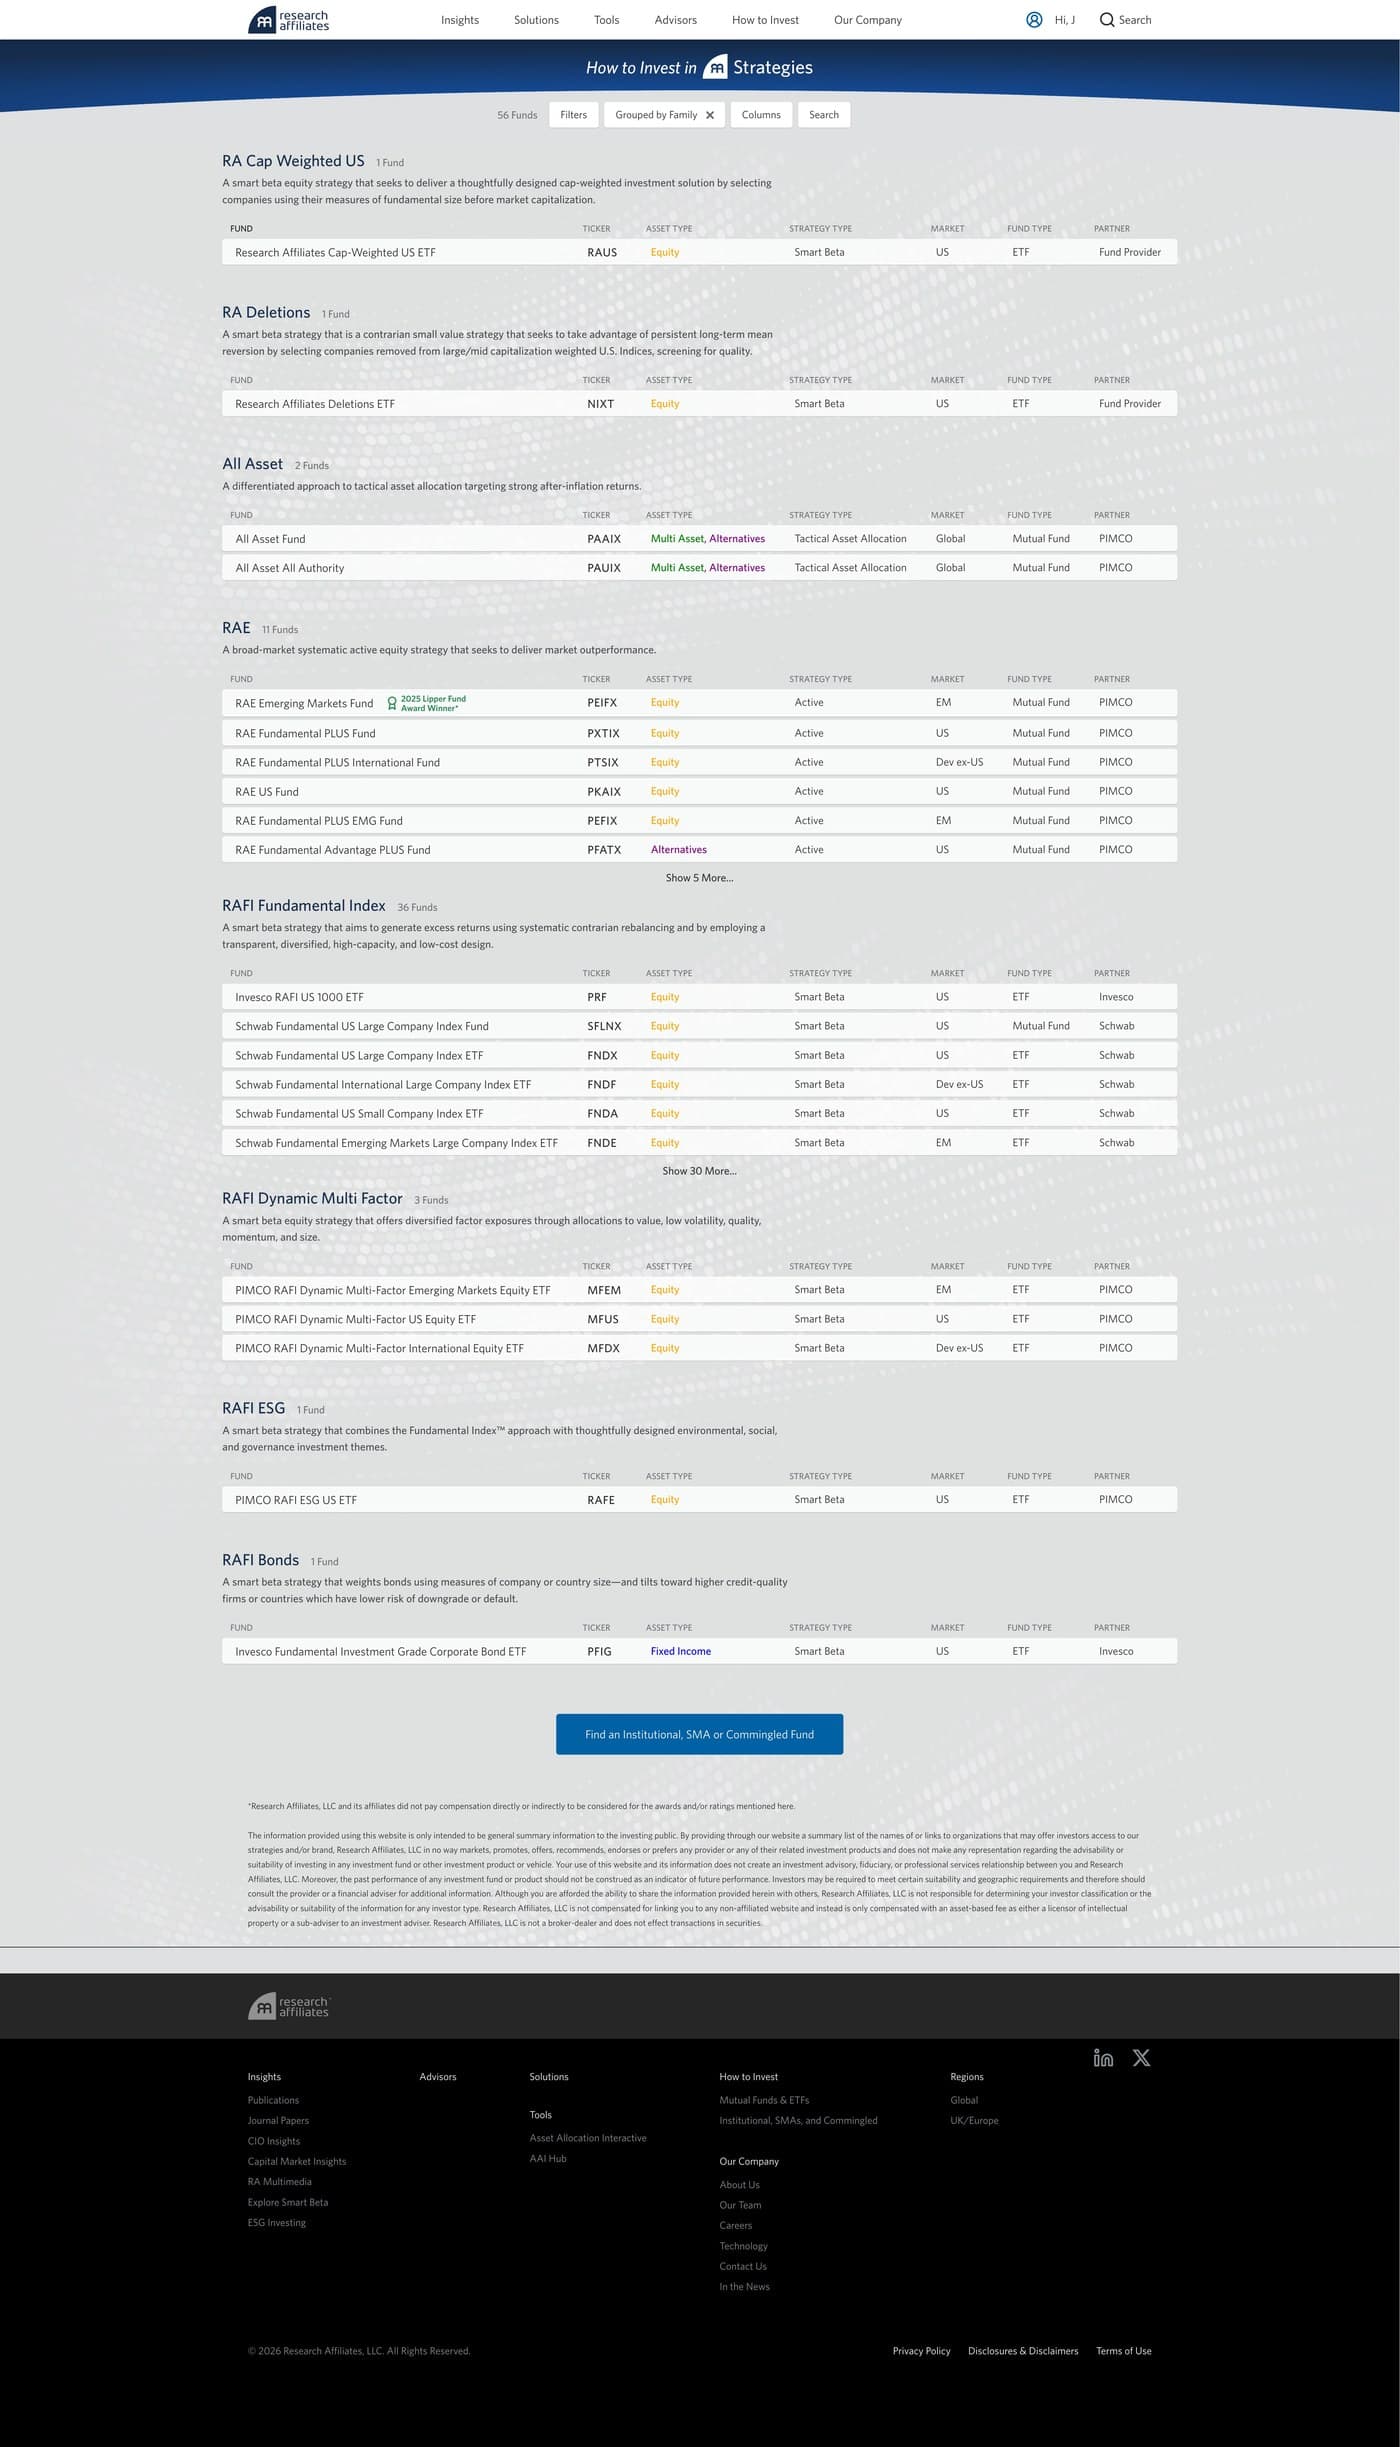
Strategy Listings. How to Invest
Beyond AAI, researchaffiliates.com included strategy listing pages connecting research to investable products. The How to Invest experience organized 56 funds across eight strategy families (RA Cap Weighted US, RA Deletions, All Asset, RAE, RAFI Fundamental Index, RAFI Dynamic Multi Factor, RAFI ESG, and RAFI Bonds) with filterable tables for Fund, Ticker, Asset Type, Strategy Type, Market, Fund Type, and Partner across PIMCO, Invesco, and Schwab.
Outcomes
+13% User Growth
+16% returning visitors and +7% session engagement signal AAI was becoming a regular part of advisors' research workflow.
Institutional Clarity
Translated proprietary valuation-dependent return models into an interface sophisticated enough for institutional use, accessible enough for advisors to navigate without training.
Scalable Product System
Established a design system spanning AAI, strategy listings, and editorial, enabling the team to ship new views and asset classes without redesigning from scratch.